
Thought Leadership

During DP1, Nira Energy helped teams model over 2,000 scenarios across 300+ projects and supported benchmarking analysis for 197 projects.
With Nira, customers were able to:
Model upgrade costs and system impacts across multiple “what-if” configurations
Benchmark outcomes to guide sizing, ERIS vs. NRIS, and withdrawal decisions
Cut decision timelines from weeks to hours by eliminating manual modeling bottlenecks
This speed and scale gave developers the agility to make confident, data-backed calls in one of the highest-stakes phases of the interconnection process.
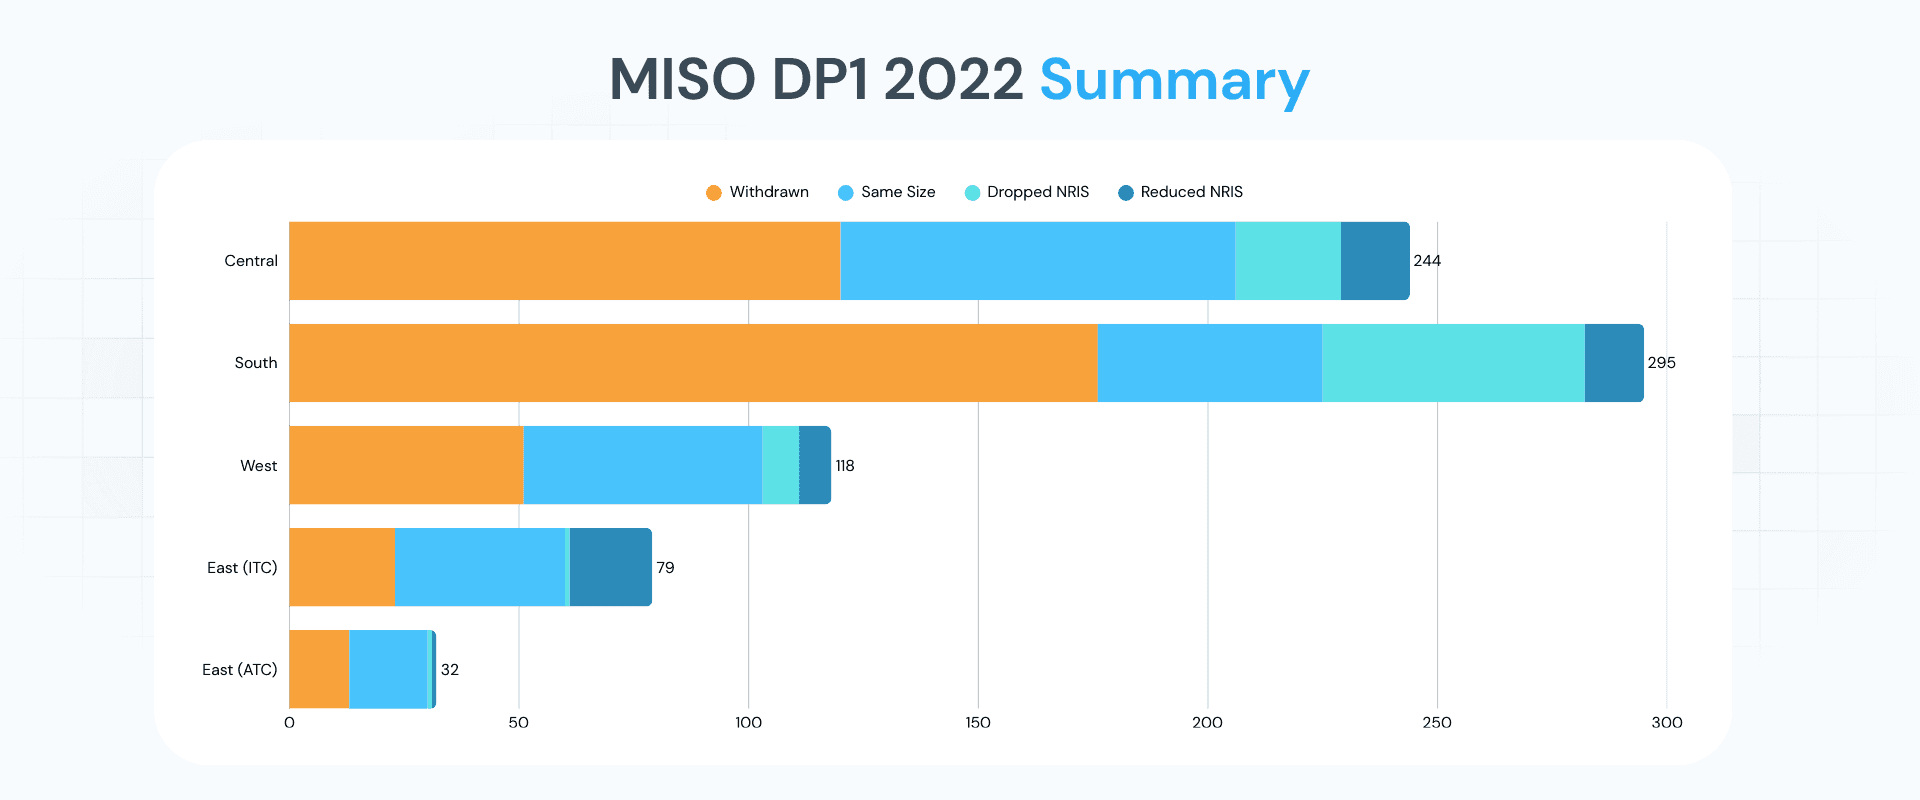
What Happened Across the Queue
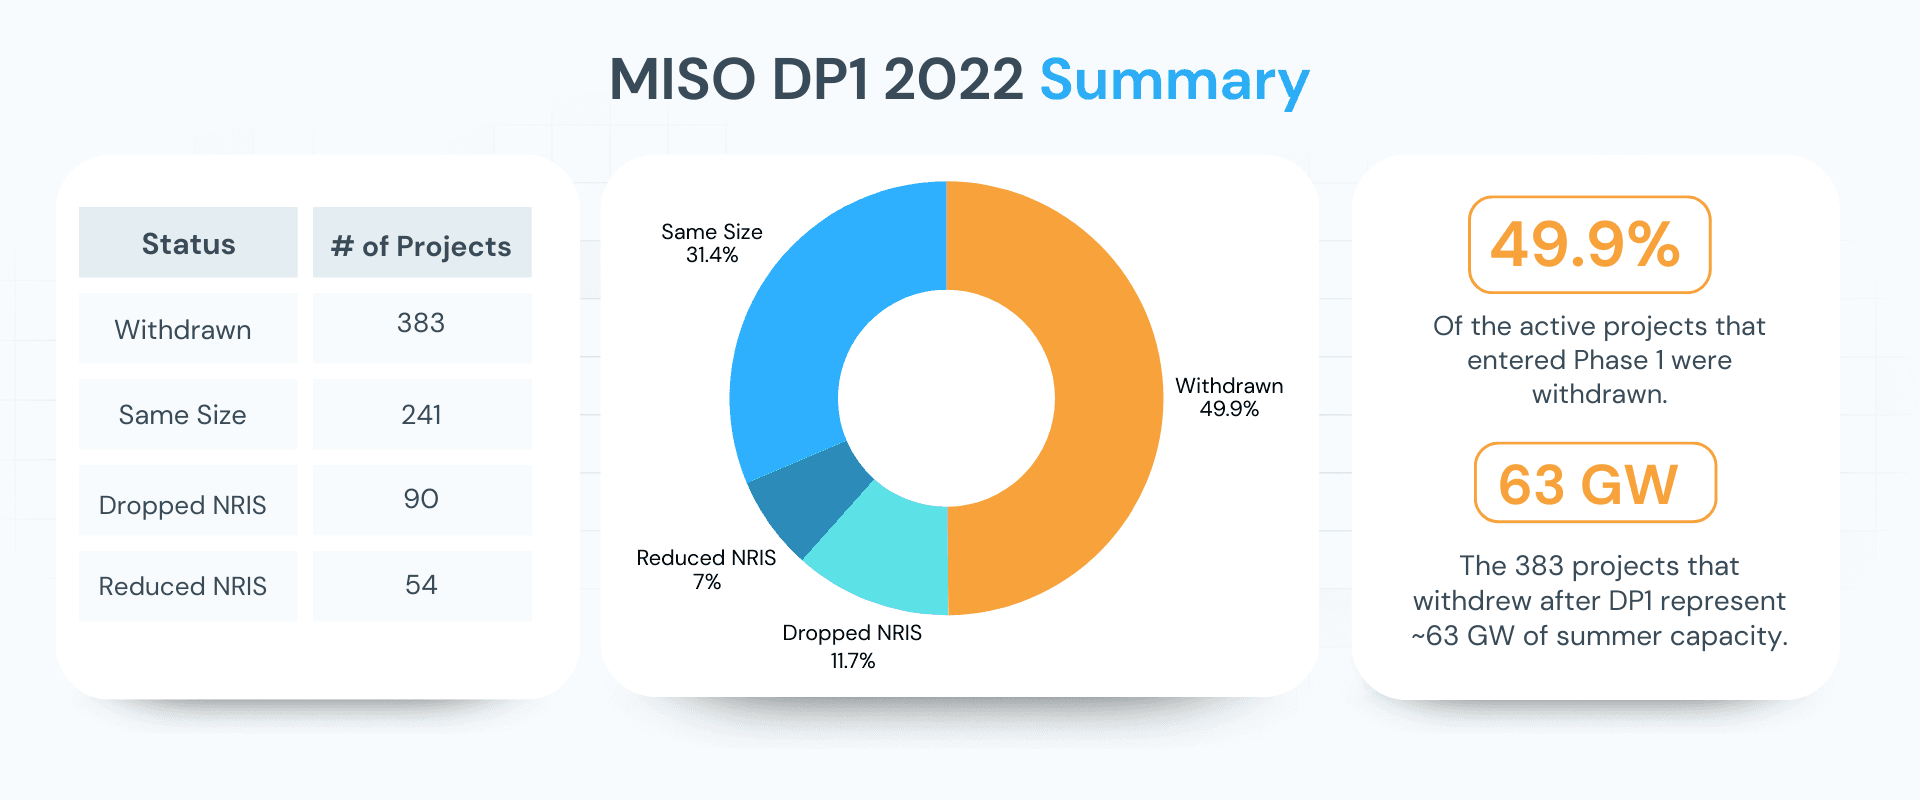
A total of 768 projects entered Phase 1 of DPP-2022. By the end of the window:
383 projects withdrew — 49.9% of the active projects that entered Phase 1
241 projects moved forward at their original requested size, including some with costs exceeding $1M/MW
90 projects dropped to ERIS-only
54 projects reduced their NRIS size but retained some capacity
The 383 projects that withdrew after DP1 represent ~63 GW of summer capacity — nearly 45% of the ~142 GW that entered Phase 1. Almost half of the interconnection capacity in DPP-2022 was gone after just one decision window — underscoring the scale and stakes of this phase.
The Cost Connection

The data tells a clear story:
Projects with higher $/MW upgrade costs were far more likely to withdraw or downsize.
Lower-cost projects were more likely to proceed at full size.
A box plot of cost percentiles by project outcome shows this trend clearly, with withdrawals clustered in higher cost ranges.
This reinforces a reality most developers know well—when costs climb, flexibility and fast modeling become non-negotiable.
For DPP-2022, the teams that combined speed, accuracy, and scenario flexibility navigated DP1 with more confidence—and, in many cases, better outcomes. As MISO heads into the next study cycle, these capabilities will only grow in importance.
→ Want to see how Nira supports decision points like these? Request a demo


